Appearance settings
Map Editor offers plenty of possibilities for customization and change of appearance for every layer. Depending on the feature type there are a number of styling options to change your layer.
Appearance settings is divided into
Find Appearance tool in Layer Properties by clicking on the icon next to the layer.
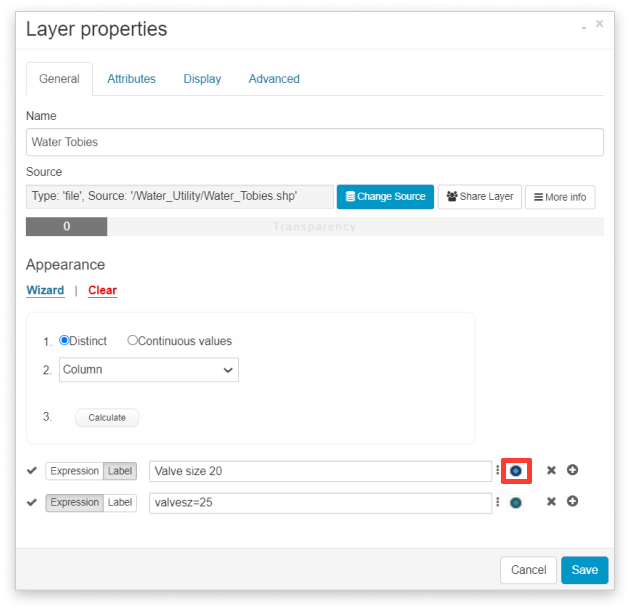
When Appearance window opens, you will see that it is divided into Style, Label and Levels. Style tab depends on the feature type, so there is slight variation for point, line and polygon layers.
Style
In Style tab, it is possible to set visual settings: colors, symbology, line width, hatch patterns.
The color can be chosen using a color diagram or by inserting HEX color code.
Point layers
For the point layers, it is possible to add predefined symbols, upload existing symbols, create a custom symbol, change their color, etc…
Note: Uploaded symbols can’t be resized in the cloud, so we suggest using icons with size from 30 to 50 pixels.
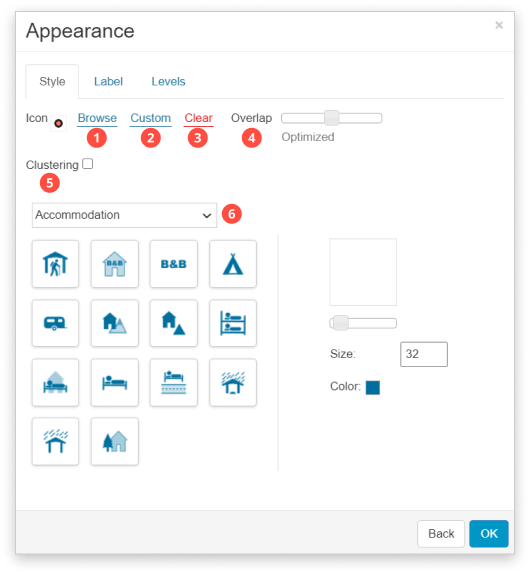
- Browse – select a symbol uploaded in File Manager. If you upload custom made icon, we suggest using icons with size from 30 to 50 pixels
- Custom – set a custom symbol. Click on the button and Symbol window will appear.
- Type – choose either circle or box
- Fill – select inner color of the point
- Border – select color of the borders of point
- Border width – define the thickness of border in pixels
- Size – type in the size of point in pixels
- Clear – clears symbology.
- Overlap – depending on the overlap, different numbers of the symbols will be displayed on the certain zoom level.
- Avoid overlapping is the fastest method.
- Optimized
- Show all symbols may affect performance.
- Clustering – system groups densely points into the one point, depending on the zoom level.
- Predefined icons – already made icons that are available to use for every user. Select a category of icons from a dropdown menu, choose one of predefined icons, then choose their size and color.
Line layers
Line layers are highly customizable as well. In Style tab, for line layers it is possible to set line and border color, line width and also to create dashed lines.
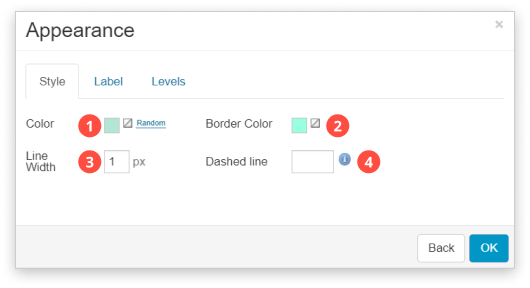
- Color – select color of line
- Border Color – select color of the borders of line
- Line width – define the thickness of border in pixels
- Dashed line – specify the dash setting. It takes an array of numbers. Numbers are specifying the sequence of dash/space/dash/space etc. When finished the sequence repeats itself to the end of the line. Some examples:
- Dashed line set to 5 – a basic setting that will result in a dashed line where both the dashes and spaces are 5 pixels in size.
- Dashed line set to 1,2 – a setting that will result in a dotted line where the dashes are 1 pixel in size and the spaces are 2 pixels.
- Dashed line set to 2,3 – another dashed line but with small dashes.
- Dashed line set to 5,5,2,2 – a setting where the first dash is five pixels, then a space of five pixels, then a dash of two pixels, then a space of two pixels, then the sequence starts again.
Polygon layers
For polygon layers it is possible to adjust inner color, border color, border width, dashed line for the border and hatch. Hatch pattern can be taken from one of the available predefined symbols or it can be uploaded to File manager as jpg. or .png file.
Note: The optimal size for icons uploaded for hatch pattern is around 50×50 pixels
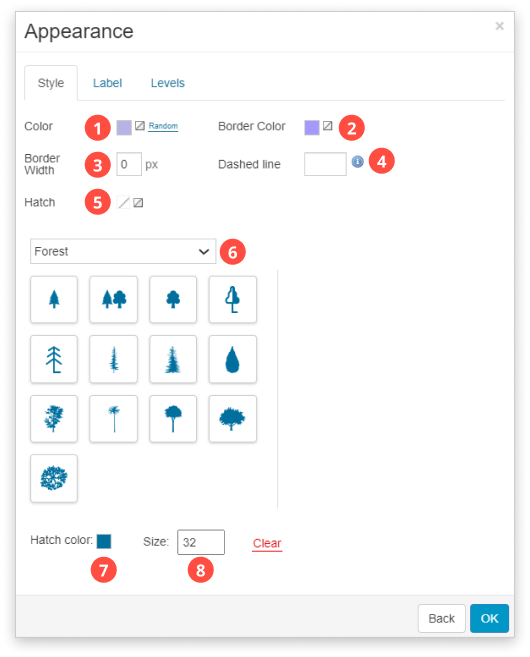
- Color – inner color of the polygon
- Border color – select color of the borders of polygon
- Border width – define the thickness of border in pixels
- Dashed line – define a custom pattern of the border line
- Hatch – upload an icon which will fill the polygons
- Predefined icons – select an icon which will fill the polygons
- Hatch color – set the color that will fill the polygons
- Size – set the size of hatch icons
Raster layers
Apart from vector data, it is possible to style raster data. One of the functions is to rescale the input pixels from the source range to the destination range. Since each raster has an input range of colors, the range has values between 0 and 255 where each value represents one color. It is possible to change the range of colors in the raster by changing the values in the destination range. Also, it is also possible to change the output format for the raster on the map. This option is usually used when the black edges in rasters are removed.
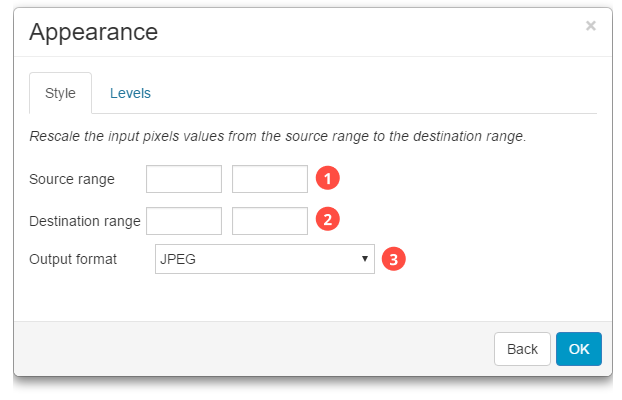
- Source range – input range of colors
- Destination range – change the values in the destination range to change the range of colors
- Output format – change the output format for the raster on the map. This option is usually used when the black edges in rasters are removed. Click here for detailed instructions.
Learn more about adding raster mosaic in our user guide.
Label
Label is a descriptive text for the features on the map. It displays feature’s attribute data. Apart from their visibility, it is possible to adjust position, fonts, colors, and placement. Labels are scaled depending on the zoom level depending on the density of the features. Permanent labels are always visible on the map, but you can also set a non-permanent label – tooltip. Find more info about adding tooltip.

- Label – select a column you want to display as a label.
- Placement – defines the position of the label in relation to the feature’s geometry. Dx and dy define offset in pixels: dx – left and right, dy – up and down.
- Margin – defines offset between labels in pixels
- Font – defines the font of the label
- Font Size – defines the font size of the label in pixels
- Font Color – defines the fill color of the label
- Outline Color – defines the outline color of the label.
Learn more about adding labels on your map in our user guide.
Levels
In the Levels tab It is possible to set a range when the geometry will be visible. Current zoom level is written in the box on the right side.
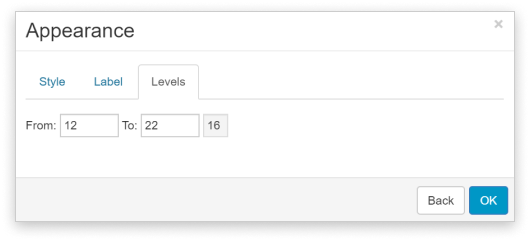
In this case, layer will be visible only when the zoom is from range 15 to range 18. In all other ranges of zoom it will not be visible. Click here for a quick video tutorial.
Learn more about setting layer visibility for different zoom levels in our user guide.
