How to make Heatmap analysis?
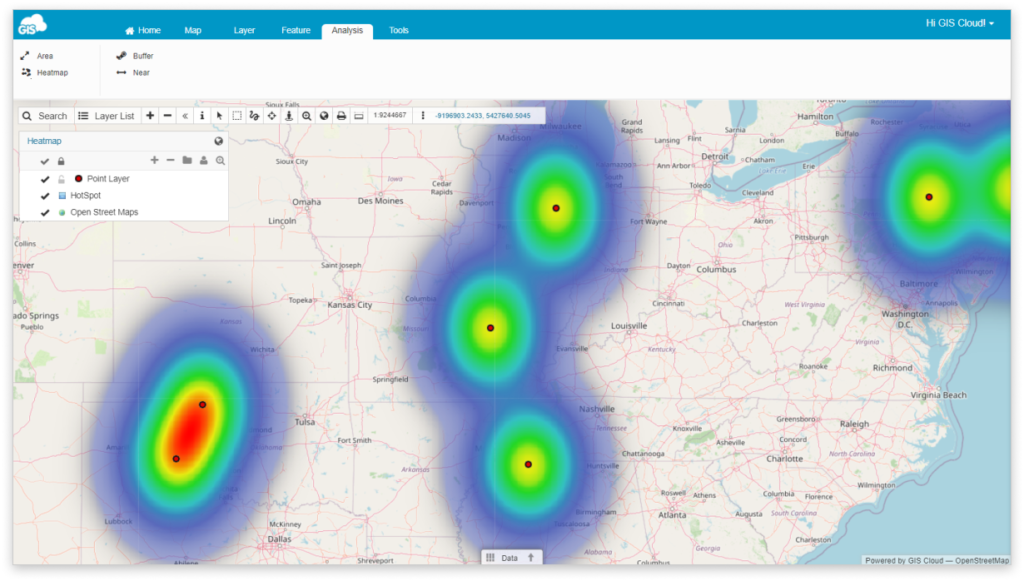
Besides the visual representation of data, one of the central functionalities of Geographic Information System is the ability to edit, analyze, connect and compare your data based on their spatial information. Heatmap analysis is a graphical representation of data that visualizes the density of points in a layer creating denser ‘clouds’ where there are high concentrations of point features.
To access analysis tools go to the Analysis tab.
It is possible to perform Heatmap analysis on the point layers that reside in File Manager or in the Database.
To calculate density of points in a layer and display it on the map:
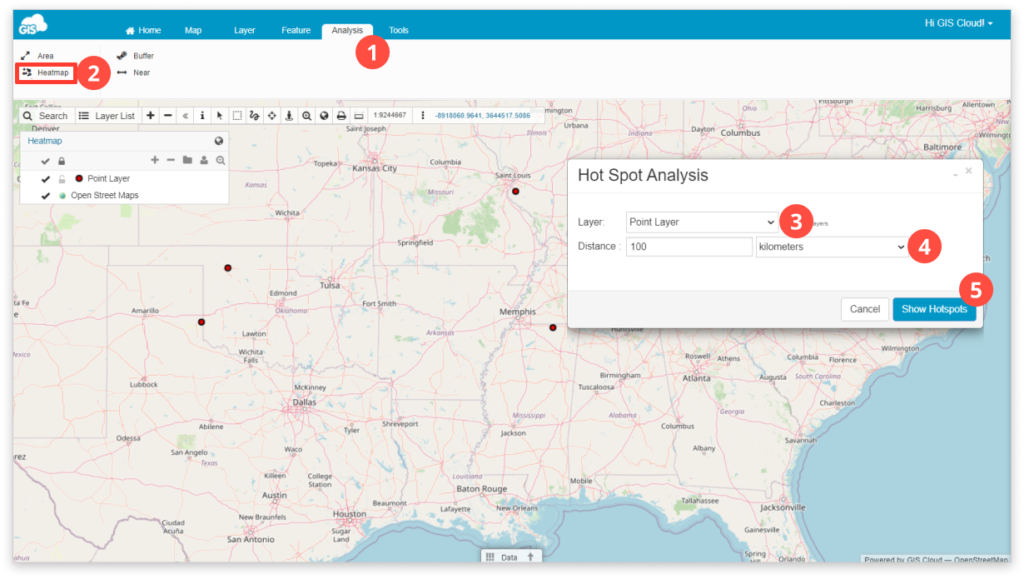
- Select the Analysis tab.
- Click the Heatmap icon.
- Select the database point layer.
- Set minimum distance between points taken into consideration to calculate density.
- Select Show hotspots to see the results.
Feel free to check out the rest of our analysis tools – Area, Buffer and Near.