Datagrid
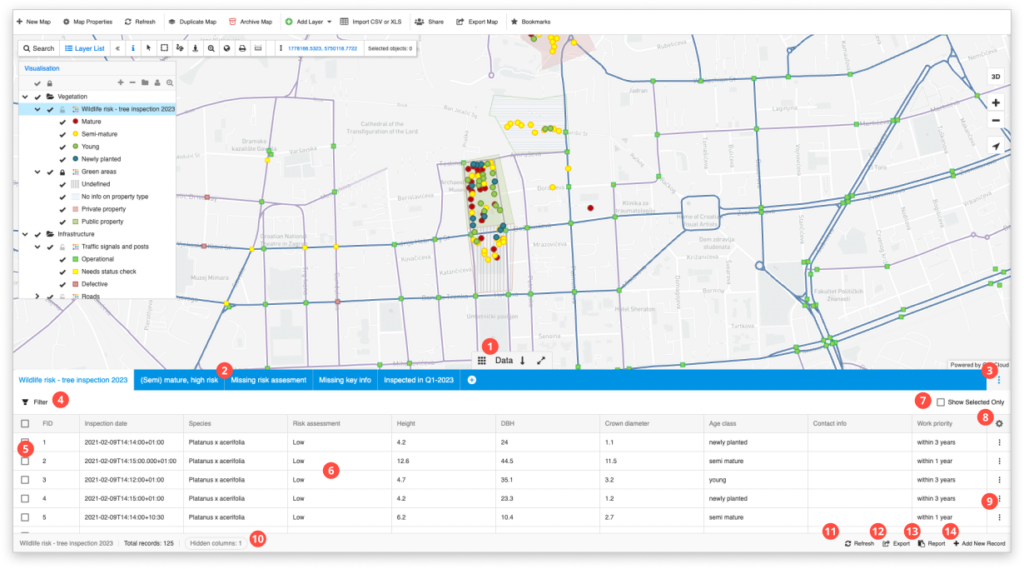
To find all of the attribute information of every feature in the layer, use Datagrid. It is placed at the bottom of the screen. First, click on the layer or feature you wish to check data and then click on the arrow to open Datagrid.

- Data button – use this button to open and close the Datagrid, use the double arrows to open the Datagrid in full screen.
- Data Views – Navigate between the default data view (first on the left) and saved custom views. Use the “+” button to add new views or manage existing data views
- View Options – Click on this button to rename, duplicate, save or delete views
- Data Filter – Opens the Filter Datagrid window where you can build expressions for filtering your data. Click here to learn more.
- Multiple selection – use the checkboxes to select multiple features. Find more info here.
- Attribute fields – shows all of the attribute information from the features in the table.
- Show only selected – tick this if you want the Datagrid to show only features which are selected on the map.
- Customize Table Columns – Click on the gear icon to rearrange the order of your columns, change their alias or hide them from the datagrid
- Feature options – click on the three dots at the end of the row to edit attribute data of a feature or delete the feature
- Records – Shows the layer name, the total number of features in the layer and the number of hidden columns
- Refresh – Refresh the current View
- Export – click on this button to export data in CSV format. Find more info here.
- Report – generates a Layer Report.
- Add New Record – Adds a new feature to the layer
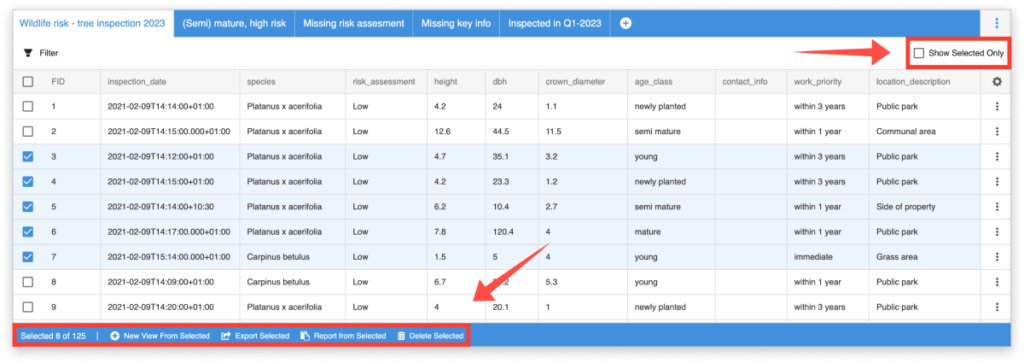
Once you have selected any number of features, you can use additional datagrid options listed below. Apart from that, you can click on the Show Selected Only checkbox to display only selected features on the map.
- New View From Selected
- Export Selected
- Report from Selected
- Delete Selected

