Edit Layer
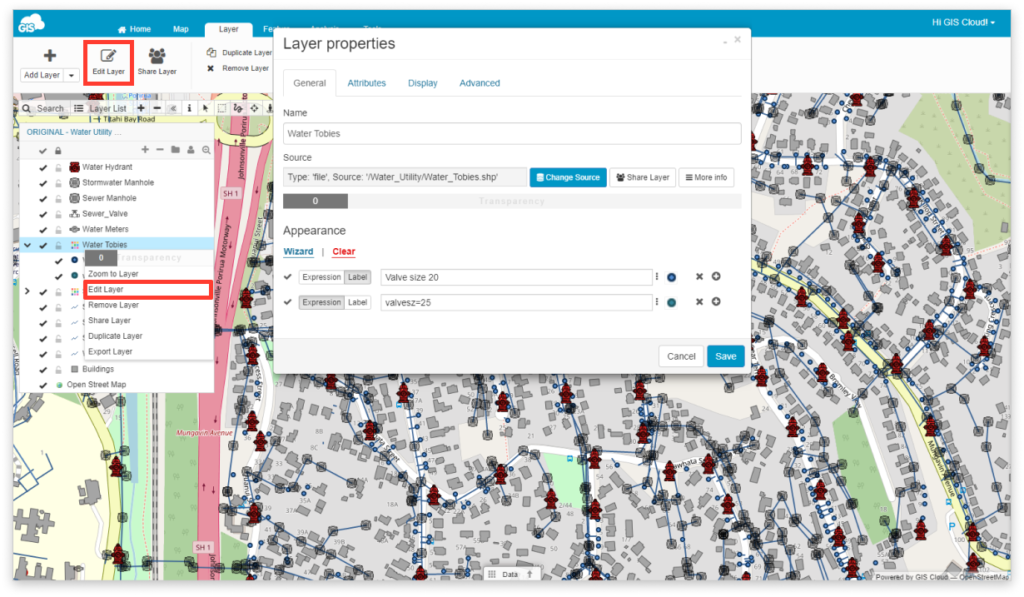
Map Editor offers plenty of editing possibilities for your data and layers. A layer can be edited through Layer Properties.
Layer properties is divided into:
There are several ways to access Layer Properties:
- Select a layer and Edit Layer tool from the Layer tab.
- Double click on the layer in the Layer List.
- Select Edit Layer function from the dropdown menu.
General settings
General settings covers basic information about the name, source and appearance of the layer.
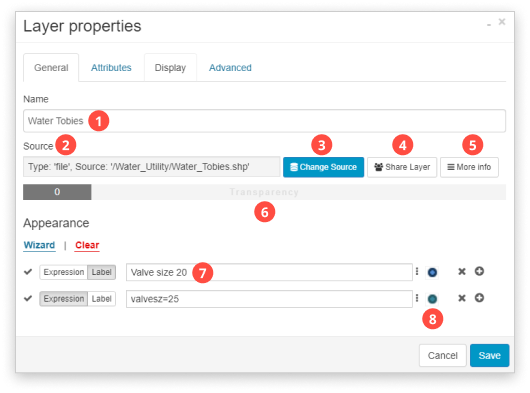
- Name – write down the name of the layer.
- Source – path to the layer’s source in Source Browser.
- Change source – if the layer source is deleted or changed, data won’t be shown in the data grid and geometry won’t be visible. It is possible to change the layer path to some other datasource. Click here for more info.
- Share layer – it is possible to share a layer within a map with different permissions then the map. Click here for more info.
- More info – display more info about the layer (layer ID, type, object count, projection).
- Transparency – set the layer transparency by dragging a slider to the right. Click here for a quick video tutorial.
- Classification – make a classification based on distinct or continuous values. Click here for more info.
- Appearance – set layer symbology, labels, visibility levels, etc. Find more info about changing layer style, icons on the map, adding labels, and setting different visibility levels.
Attributes settings
In Attributes settings it is possible to manage layers’s attributes that are displayed in the data grid e.g. reorder columns and set which layers attributes you want to view or show in the attributes table.
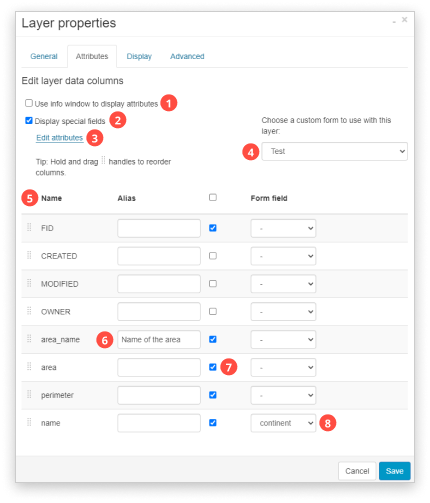
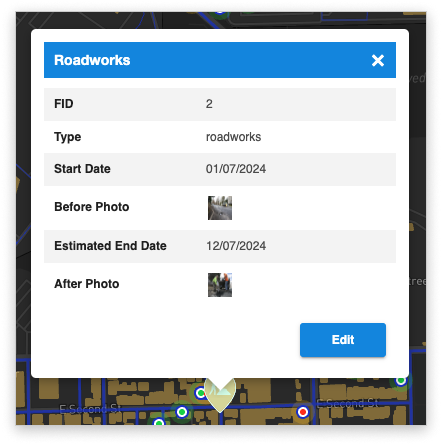
- Use info window to display attributes – display attributes right on the map in a pop-up window. Learn how to customise it here!
- Display special fields – display automatically generated fields like CREATED, MODIFIED, OWNER
- CREATED field contains information about the time when the created feature is saved or the collected point reached our servers. This field is displayed in the data grid and exported in UTC time zone.
- MODIFIED field contains information about the time when the edited feature is saved or an updated point reached our servers. This field is displayed in the data grid and exported in UTC time zone.
- OWNER field contains information about the layer owner and, if the feature was edited, who edited it.
- Edit attributes – edit layer structure, add and remove columns. Click here for more info.
- Connect a form with the layer – to use layer in the Mobile Data Collection project, layer has to be connected with the form. Click here for more info.
- Reorder columns – hold and drag to change column order.
- Alias – set an alternate name for a column.
- Visibility – if the box is checked, the column will be visible in the Data grid.
- Form field – connect a field with the correct form field.
Note: The info window not only displays attributes, it also includes a preview of the media that is attached to the features.
Display settings
Layer bounds define a box within which the layers’s features are visible. If the feature resides outside the bounding box, it won’t be visible. Note that the layer bounds coordinates have to be defined in the map projection.
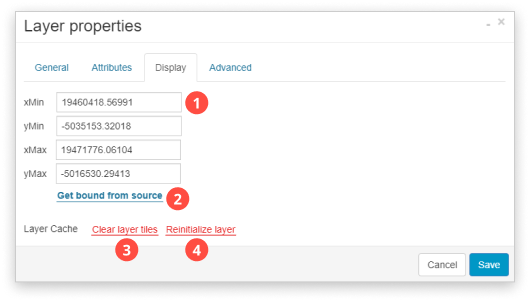
- Layer bounds – layer bounding box. Numbers represent bottom-left (xMin, yMin) and top-right (xMax,yMax) coordinate. Features within this bounding box will be visible on a map. In this box you can manually adjust layer bounds.
- Get bound from source – automatically adjust layer bounds.
- Clear layer tiles – this option is useful if you experience difficulties with the layer. It is usually used after adding a new column in the data grid, after classification or updating layer source.
- Reinitialize layer – layer will be reset, and manually adjusted layer bounds will be reset as well. If you experience difficulties with the layer you can click Reinitialize layer.
Advanced settings
Under advanced settings you can set layer encoding, tooltip, hide geometry, set geometry precision or add layer options.
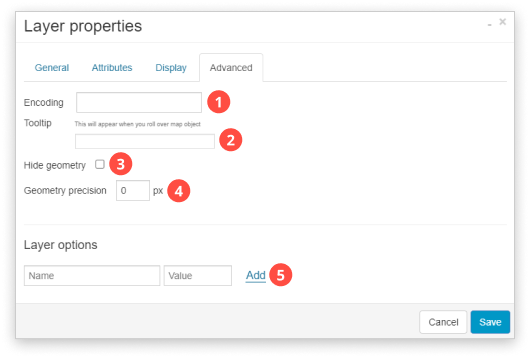
- Encoding – defines system in which data in data grid will be displayed. If you use non-latin script, then it is possible that data will not be shown correctly in the data grid. In this case, you can select encoding from the dropdown list. Default encoding for the most layers is UTF-8.
- Tooltip – non-permanent label that appears when you roll over a map object. Type in the attribute column name in an empty box which attribute you wish to appear on the map. Click here to watch a short video tutorial. It is possible to set up a permanent label as well.
- Hide geometry – if the option is enabled, layer geometry won’t be visible. Note that the layer’s labels will still be visible.
- Geometry Precision – defines resolution of drawn tiles when zooming in and out the map.
- Layer Options – GIS Cloud offers plenty of possibilities to customize and modify your layers and maps.
